How to Panel data python – An easy introduction
Panel data (or longitudinal data) comprises time series for each cross sectional unit in a data set. In other words, in panel data, we consider the same cross sectional units over multiple time points. Examples include units such as countries, cities, firms, households, individuals. In this context, we can think of pure time series and pure cross sectional data as a subset of panel data with only one dimension.
In this article, we discuss panel data python and panel data regression python. We also provide the python panel data examples illustrating the econometrics concepts.
Panel vs. Pooled data
According to Eviews documentation, pooled data refers to data with relatively few cross-sections, where variables are held in cross-section specific individual series, meanwhile panel data corresponds to data with large numbers of cross-sections, with variables held in single series in a stacked form.
Some experts refer to Pooled data as "time series of cross sections", where observations in each cross section do not necessarily refer to the same unit. Whereas, panel data refers to samples of the same cross-sectional units at multiple points in time. A panel-data observation has two dimensions:
A variable denoted by X indexed by two subscripts i and t, where i runs from 1 to N and denotes the cross sectional unit and t runs from 1 to T, and denotes the time of the observation.
Advantages and Disadvantages of Panel data
There are numerous benefits of panel data over cross sectional and time-series data:
- In panel data multiple observations of the same entities allow us to control for unobserved characteristics.
- Panel data facilitates causal inference which would be difficult with one cross-section or time-series data set.
- Panel data allows us to study significance of lags in behavior and results of decision-making across time and entities.
Nevertheless, for a data scientist, it might be difficult to obtain panel data since it requires replication of the same entities over multiple periods.
Types of Panel data
We can consider panel data as balanced or unbalanced. If each cross sectional unit is observed in all time periods panel data is balanced. While an unbalanced data set is one where units are not observed in all time periods and contain missing values.
Econometricians also separate panel data into a wide or a long one. In a wide panel data a row or a column represents one observational unit for all points in time, while in a long panel data a row or a column holds one observation per period.
An example of a Panel data set
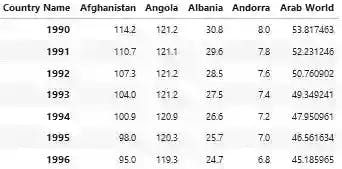
An example of a wide unbalanced panel data set is World Health Organization crude birth rates data set available on Kaggle. For 10 of 239 countries and regions crude birth observations span 60 years from 1960 to 2019 while for others only a few periods. The large amount of missing values is likely due to the high administrative cost of collecting the necessary information.
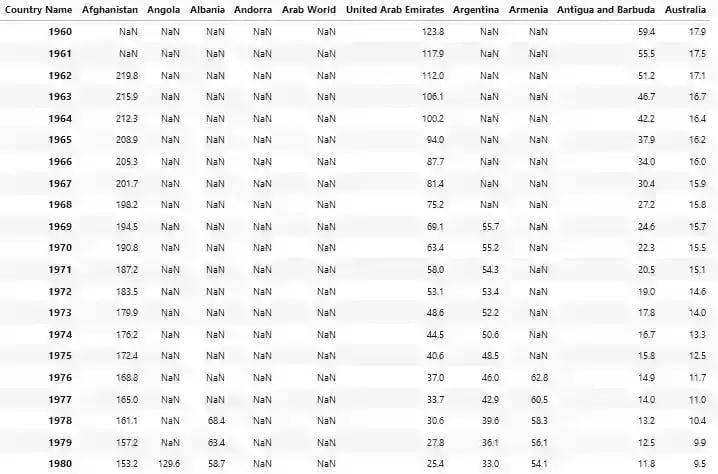
In the table above, we display crude birth rates for first 10 countries and regions in alphabetical order. We observe that United Arab Emirates, Antigua and Barbuda and Australia have no missing data points for from 1960 to 1980.
Pandas is an open source Python package that data scientists use for data analysis and machine learning tasks. It is built on top of package named Numpy. Numpy is one of the most commonly used packages for scientific computing in Python. It provides a multi-dimensional array object, as well as variations such as masks and matrices, which can be used for math operations.
Pandas is also supported by Dask, flexible open-source Python library for parallel computing.
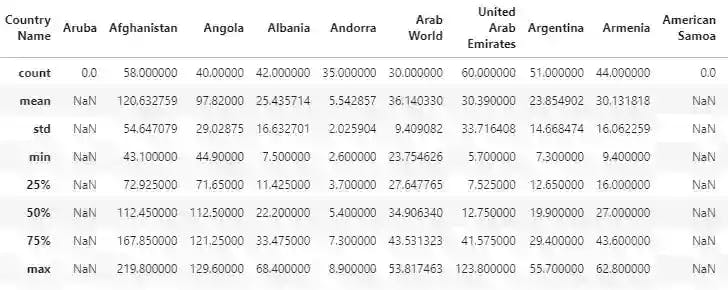
We use the WHO crude births data set to visualize features of the data set. You can use pandas library to load the file into DataFrame and generate descriptive statistics for each country/region with the help of describe() method.
Descriptive statistics includes the count of values, mean and standard deviation, minimum and maximum values as well as 25th percentile vale, 50th percentile value (also median) and 75th percentile.
import pandas as pd
cols2skip = [1,2,3]
df = pd.read_csv('file.csv', skiprows=3, /
 usecols=[i for i in range(64) if i not in cols2skip], /
 index_col='Country Name').T
df.describe()
Panel data python with Pandas
As we can see from the picture, some of the columns contain full NaNs, hence it is reasonable to drop such data:
df = df.dropna(axis=1, how='all')
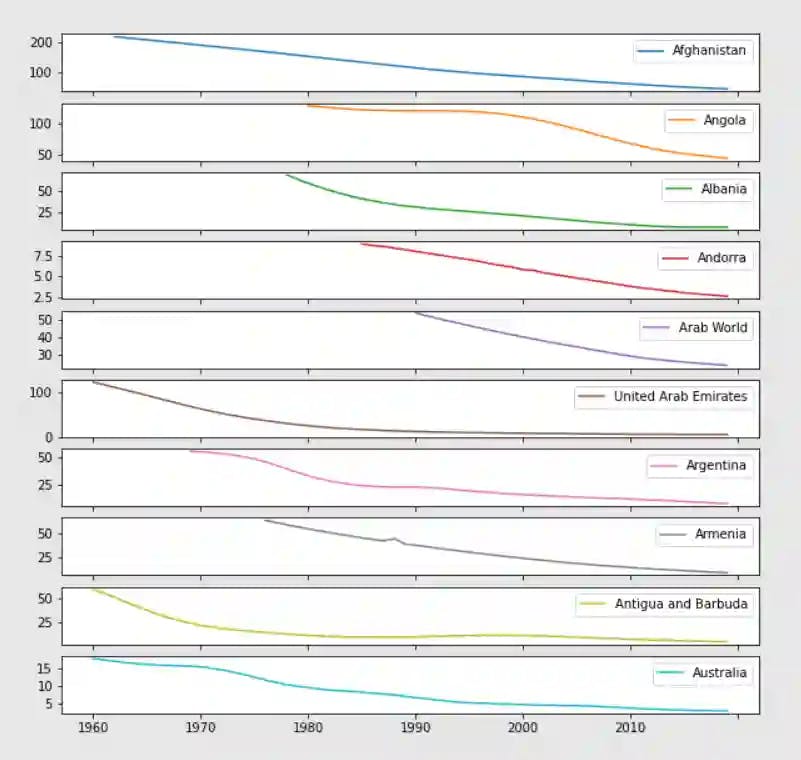
We further explore the patterns in the crude birth rates and display the data for the first 10 countries. For interactive visualizations in Python we use Matplotlib library.
import matplotlib.pyplot as plt
df.iloc[:,:10].plot(subplots=True, figsize=(20,60))
plt.show()
Panel data python: data transformation
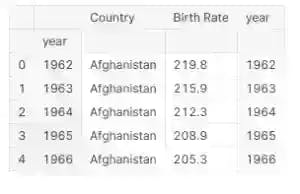
To conduct statistical analysis and model the birth rates we have to convert data into an appropriate format for panel data analysis. In the following code we use pandas.melt to massage a DataFrame into a format where one or more columns are identifier variables, while all other columns are measured variables. We also drop missing values, however, some consider interpolation or other techniques of filling missing values. The entity identifier is the index from the previous data frame and the year that we also convert into a separate categorical column for dummy variables creation.
year = df.index
df['year'] = year.astype(int)
df = df.melt(id_vars=["year"],
        var_name="Country",
        value_name="Birth Rate")/
        .dropna().reset_index(drop=True)
year = df.year
df = df.set_index([df.index, 'year'])
df['year'] = pd.Categorical(year)
df.head()
Panel data analysis
Panel data analysis is a statistical method widespread in the fields of economics, finance and epidemiology to analyze two-dimensional panel data. In a production environment regression estimation and data modeling traditionally follows the collection of a data set. The three most ubiquitous panel data models are a pooled model, a fixed effects model and a random effects model.
Why panel data regression python?
Since the fundamental principle of regression is to estimate the mean values and a single point in time, it might be interesting to investigate whether a linear model based on regression works in the case of multiple observations of the same entities in a panel data set. This is one of the reasons why panel data regression is an important data science tool in data science.
Also, it is important to consider the time-variation of a variable in the cross-section of panel data to estimate its dependence on time. However, in data analysis, we usually use a regression model which is centered on the cross-section and allows us to estimate the dependency of a variable on the time (i.e., linear regression).
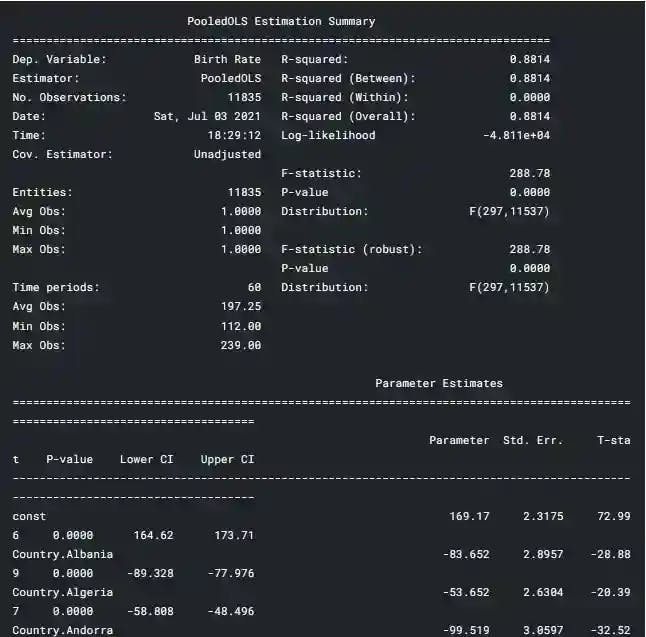
Panel data python: Pooled OLS regression
For an estimation of pooled OLS regression we use python linearmodels library. In addition, for a creation of a constant as input to linear equation we use python statsmodels library.
exog_vars = ["Country", 'year']
exog = sm.add_constant(df[exog_vars])
mod = PooledOLS(df['Birth Rate'], exog)
pooled_res = mod.fit()
print(pooled_res)
References and Related Posts
- Bashtage.github.io. n.d. Examples — linearmodels v4.24 documentation.
- Cross Validated. n.d. What is the difference between pooled cross sectional data and panel data?.
- Wooldridge, J., 2019. Introductory econometrics. 7th ed.
- Kaggle notebook
- Blockchain Data Indexer with TrueBlocks
- Advanced Realized Volatility and Quarticity
- Machine Learning with Sklearn
- How to illustrate log returns vs simple returns
- A How to EfficientNet Classification
- Unlock the Power of Decentralization with PinSave