Cross-sectional data – An easy introduction
- Authors

- Name
- Pavel Fedotov
- @pfedprog
Econometric data sets come in numerous shapes, forms and types such as cross-sectional, time-series and panel data. The data type affects the analysis and estimation methods that we as data scientists can use. In this article we are introducing the concept of cross sectional data and demonstrate cross sectional data examples.
What is cross sectional data?
A cross sectional study includes cross sectional data. A cross sectional data set consists of a sample of units such as individuals, households, firms, cities, states, countries at a given point in time. A cross sectional data set compares differences between respondents.
Essentially, cross sectional data is data that is obtained from all participants at the same time. During cross-sectional research,we do not regard time as a study variable. However, it is also true that in a cross-sectional research, not all the participants provide information at the same time.
In a pure cross sectional analysis, we ignore any minor timing differences in a data example. If a researcher conducted a survey during different weeks of the same year, we would still consider this as a cross sectional data example. Cross sectional data differs from longitudinal data, which includes several observations for each unit throughout time.
For instance, the gross yearly income for each of 1000 randomly selected families in United States in 2022 constitutes a cross sectional data example.
Cross sectional data vs time series
Cross sectional data is a type of data that is collected from a variety of different sources, such as surveys, interviews, and focus groups. Cross sectional data can be used to understand the behavior, preferences, and thoughts of a specific group of people. Time series data is a type of data that is collected from a single source, such as a single day or week. Time series data data can be used to understand the behavior, preferences, and thoughts of a specific group of people over time.
Both cross sectional data and time series data are valuable data sources, but they have different purposes. Cross sectional data can be used to understand the behavior, preferences, and thoughts of a specific group of people, while time series data can be used to understand the behavior, preferences, and thoughts of a specific group of people over time. Cross sectional data and time series data can both be used to provide valuable insights into the world, but they are different types of data.
Cross sectional data analysis
Cross sectional data analysis is a powerful tool that can be used to understand the behavior and preferences of a population of objects or people. By analyzing the data collected from a sample of objects or people, you can identify patterns and trends that can help you understand the behavior of your target population. This is especially important in business or marketing settings, where you need to understand the behavior of your target audience to make informed decisions. By using cross sectional data analysis, you can identify the types of customers who are most likely to purchase your product or service, and you can also identify the types of products or services that are most popular among your target audience.
Cross sectional data example: Titanic Kaggle Dataset
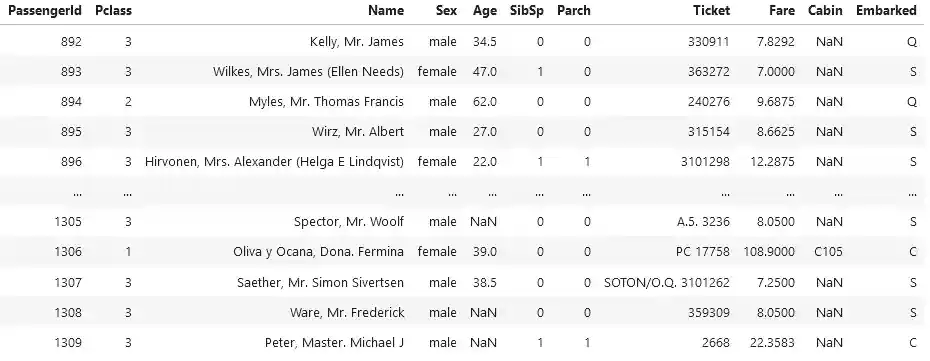
We demonstrate a cross sectional data example for econometric analysis with the help of Python. The table below contains a cross sectional data example on Titanic passengers on April 15th, 1912.
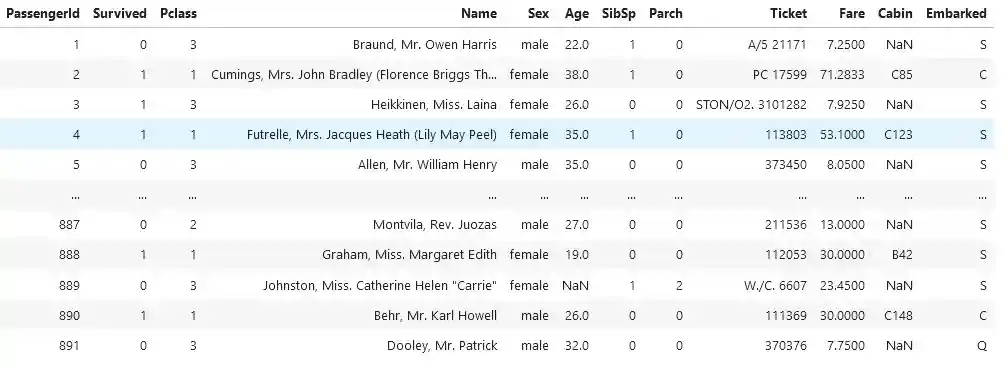
The variables include PassengerID - passenger identification number, Survived - indicator of survival, Pclass - ticket class, Name, Sex, Age in years, SibSp - the number of siblings/spouses aboard the Titanic, Parch - the number of parents / children aboard the Titanic, Ticket number, Fare, Cabin number and Embarked - Port of Embarkation. Survival and Sex variables are binary (zero-one) and indicate features of the individual.
The variable PassengerID in the cross sectional data example is the observation number for each individual in the sample. Unlike the other variables, it is not a characteristic of the individual.
The fact that the ordering of the data does not matter for an analysis is a key feature of cross sectional data examples.
Cross sectional data example: Melbourne Housing Kaggle Dataset
Different variables sometimes correspond to different time periods in cross sectional data examples. For example, to assess the housing market in Melbourne and determine the key price determinants we can study the relationship between the price of houses over a certain period. Such cross sectional data example is also available on Kaggle.
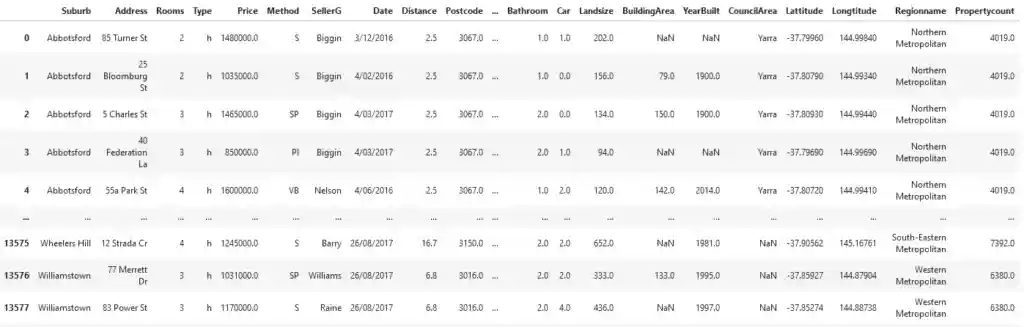
The variable Price is a price in dollars which is the target of our study. The fact that prices correspond to different dates, does not lead to any special problems in treating this information as a cross sectional data set. The creators of the data set ordered the observations alphabetically by suburb, but such ordering does not affect further cross sectional analysis.
Random Sampling
An important feature of cross sectional data is that we can often assume that data scientists obtained it by random sampling from the underlying population. For example, if we obtain information on emergency preparedness such as presence of a generator, nonperishable emergency food, an evacuation vehicle, and other characteristics by randomly drawing 350 households from the city, then we have a random sample from the population of all households in a given city.
However, random sampling sometimes may not be not appropriate assumption for a cross sectional data analysis. For example, suppose we are studying factors that influence the accumulation of wealth. We survey a random sample of people, but some might have refused to report their wealth. For instance, if wealthier people are less likely to disclose their wealth, then our sample on wealth is not a random sample from the population of all people.
Another violation of random sampling occurs when we sample from units that are large relative to the population. The potential problem in such cases is that the population is relatively small to assume that the observations are independent. For example, if we want to explain economic growth across countries it is unlikely that the economic growth in countries near one another is independent.