Gitcoin Beta Round Statistics: An In-Depth Analysis of Grant Funding Trends
Welcome to this post on Gitcoin Beta Round Stats! In the world of grants and funding, organizations and platforms often have multiple rounds of funding to support a variety of projects. In this post, we will explore the data from Gitcoin Beta Round and gain insights into the grant funding process. We will analyze the rounds and the number of grants in each round, examine the summary statistics of the funding amounts, and explore the correlations between different variables. Join us on this data-driven journey as we delve into the fascinating world of grant funding and uncover valuable insights from the Gitcoin Beta Round Stats.
Beta Round Stats. What are the rounds, how many grants in each round?
First we import the python libraries:
import numpy as np
import pandas as pd
import matplotlib.pyplot as plt
import seaborn as sns
import scipy.stats as stats
import statsmodels.api as sm
import plotly.express as px
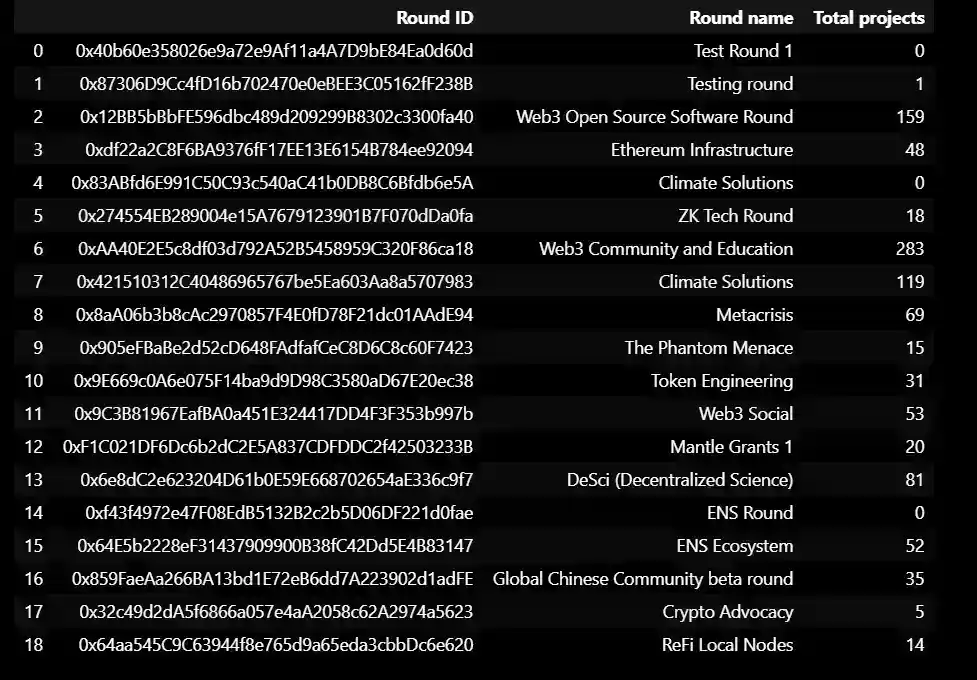
Here is the data on rounds:
data
data.info()
<class 'pandas.core.frame.DataFrame'>
RangeIndex: 19 entries, 0 to 18
Data columns (total 3 columns):
 #   Column          Non-Null Count  Dtype
---  ------          --------------  -----
 0   Round ID        19 non-null     object
 1   Round name      19 non-null     object
 2   Total projects  19 non-null     int64
dtypes: int64(1), object(2)
memory usage: 588.0+ bytes
This data represents various rounds of grants provided by an organization or platform. Each round has a unique Round ID and Round name. The column "Total Projects" signifies the number of projects funded in each round. The data also includes the Ethereum wallet addresses associated with each round. This output is the information about the DataFrame 'data'. It shows that the DataFrame has 19 entries (rows) and 3 columns. The 'Round ID' and 'Round name' columns are of object (string) data type, and the 'Total projects' column is of integer data type. It also shows that there are no missing values in any of the columns. Finally, it displays the memory usage of the DataFrame.
data.describe()
    Total projects
count 19.000000
mean 52.789474
std 70.348007
min 0.000000
25% 9.500000
50% 31.000000
75% 61.000000
max 283.000000
This output shows the descriptive statistics of the 'Total projects' column of the DataFrame 'data'.
- count: the number of non-null values in the column.
- mean: the average value of the column.
- std: the standard deviation of the column.
- min: the minimum value of the column.
- 25%: the value below which 25% of the data falls.
- 50%: the median value of the column (the value below which 50% of the data falls).
- 75%: the value below which 75% of the data falls.
- max: the maximum value of the column.
The 'Total projects' column has 19 non-null values, with an average of 52.79 projects per round, and a standard deviation of 70.35 projects. The minimum number of projects funded in a round was 0, while the maximum was 283.
plt.hist(data["Total projects"], bins=5)
plt.xlabel("Total projects")
plt.ylabel("Frequency")
plt.show()
 This code creates a histogram of the 'Total projects' column of the DataFrame 'data'. The 'Total projects' column contains the number of projects funded in each round of the grants program.
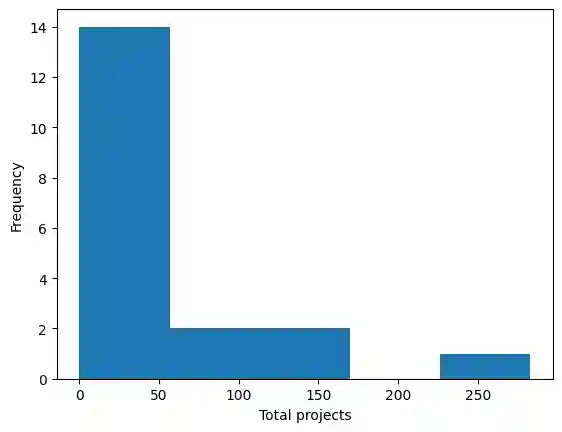
The histogram shows the distribution of the number of projects funded across the different rounds. The x-axis represents the `Total projects``, and the y-axis represents the frequency of the number of rounds with a particular number of projects funded.The histogram is divided into 5 bars.
The x-axis label is set to "Total projects", and the y-axis label is set to "Frequency".
From the data table, we can see that the "Total projects" variable contains integer values ranging from 0 to 283. The histogram shows that most of the observations fall into the first bin (0-56), with very few observations in other bins. This suggests that most of the rounds have relatively low numbers of total projects, while a few rounds have much larger numbers of total projects.
The histogram also shows that the distribution of the "Total projects" variable is heavily skewed to the right, which means that there are a few projects with extremely high numbers of total projects that are driving the average value up. This skewness should be taken into account when interpreting any statistical analyses or models that use this variable as a predictor or outcome.
Beta Round Data Set. Summary stats at the time this was gathered by each round
data2
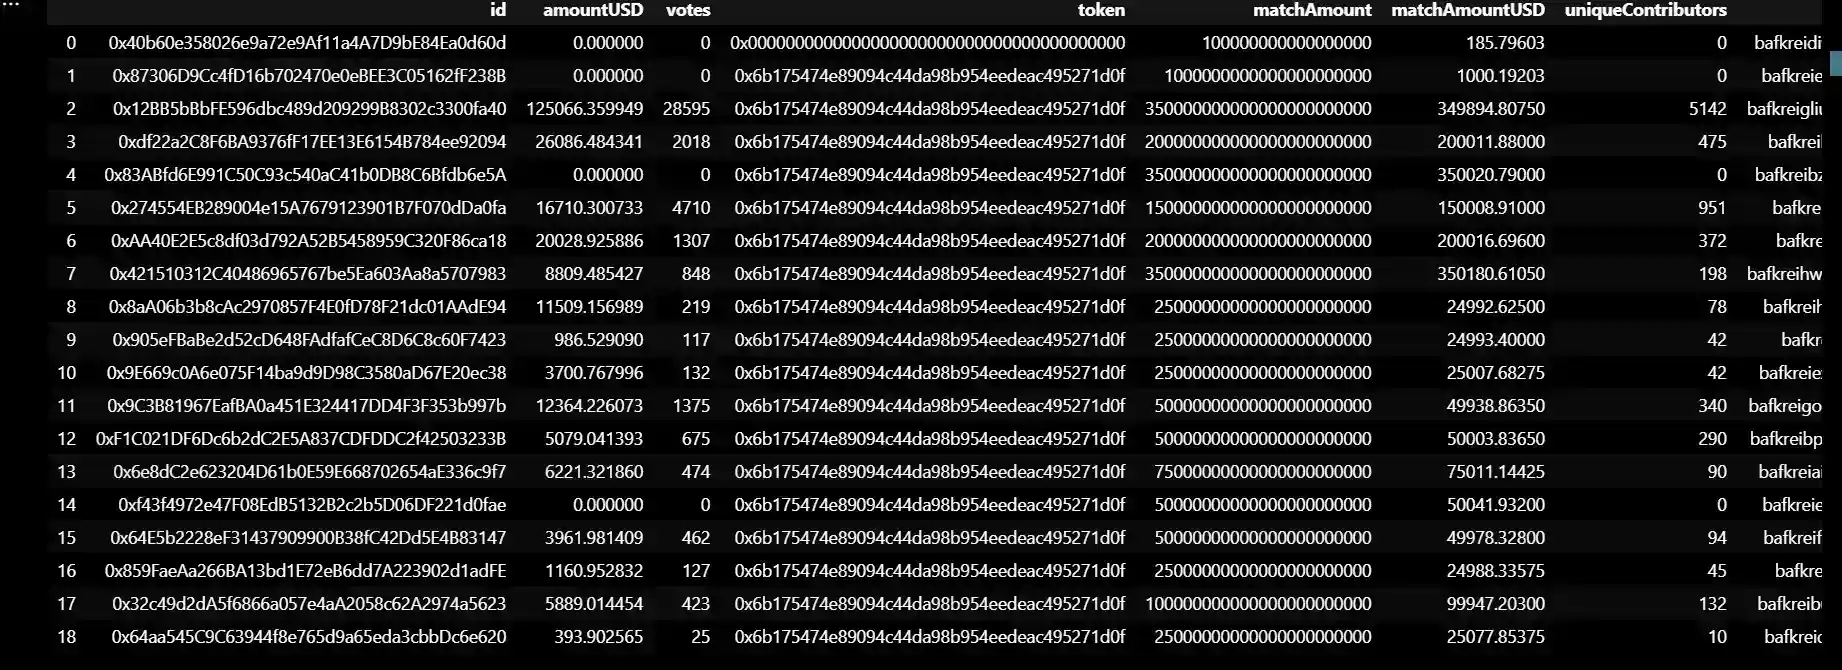
This data connected with rowdfunding platform or grant program. It contains various columns with information about the grants, such as:
- id: a unique identifier for each grant project.
- amountUSD: the amount of money raised in USD for each project.
- votes: the number of votes received for each project.
- token: the type of token used for the crowdfunding.
- matchAmount: the amount of funds matched for each project.
- matchAmountUSD: the amount of funds matched for each project in USD.
- uniqueContributors: the number of unique contributors to each project.
- applicationMetaPtr: a pointer to the metadata associated with each project.
- metaPtr: a pointer to the metadata associated with each project.
- applicationsStartTime: the start time of each crowdfunding campaign.
The data also includes columns related to the crowdfunding platform's metadata, such as fees, quadratic funding configuration, and minimum donation thresholds.
data2.info()
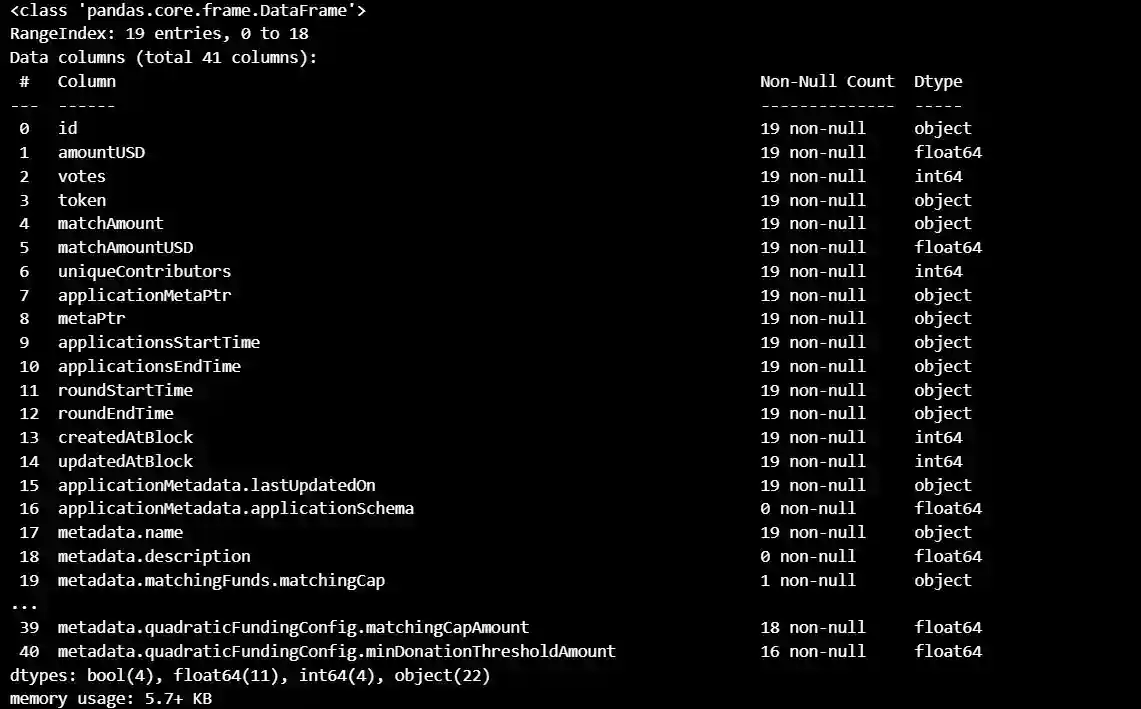
This is a pandas DataFrame with 19 rows and 41 columns. Each row represents a different funding round for a project, and each column provides information about that round or project.
The columns include:
- id: a unique identifier for the project
- amountUSD: the amount of funding in USD for the round
- votes: the number of votes received for the project in the round
- token: the token used for funding
- matchAmount: the amount of matching funds available for the round
- matchAmountUSD: the amount of matching funds available in USD for the round
- uniqueContributors: the number of unique contributors in the round
- applicationMetaPtr: a pointer to additional metadata about the project
- metaPtr: a pointer to additional metadata about the project
- applicationsStartTime: the start time of the funding round
- applicationsEndTime: the end time of the funding round
- roundStartTime: the start time of the round
- roundEndTime: the end time of the round
- createdAtBlock: the block at which the funding round was created
- updatedAtBlock: the block at which the funding round was last updated
- applicationMetadata. lastUpdatedOn: the date and time at which the metadata for the project was last updated
- applicationMetadata. applicationSchema: information about the schema used for the project application
- metadata.name: the name of the project
- metadata.description: a description of the project
- metadata.matchingFunds. matchingCap: the maximum amount of matching funds available for the project
- metadata.matchingFunds. matchingFundsAvailable: the amount of matching funds available for the project
- metadata.support.type: the type of support offered by the project
- metadata.support.info: additional information about the support offered by the project
- metadata.eligibility. description: a description of the eligibility requirements for the project
- metadata.eligibility. requirements: the specific requirements for eligibility for the project
- metadata. programContractAddress: the address of the contract for project
- metadata.matchingFunds. matchingCapAmount: the maximum amount of matching funds available for the project
- applicationMetadata. applicationSchema.questions: the questions asked in the project application
- applicationMetadata. applicationSchema. requirements. twitter.required: whether a Twitter account is required for the project
- applicationMetadata. applicationSchema. requirements. twitter.verification: whether a Twitter account needs to be verified for the project
- applicationMetadata. applicationSchema. requirements. github.required: whether a GitHub account is required for the project
- applicationMetadata. applicationSchema. requirements. github.verification: whether a GitHub account needs to be verified for the project
- applicationMetadata.version: the version of the project application schema used
- metadata.feesPercentage: the percentage of fees charged by the platform for the project
- metadata.feesAddress: the address to which fees are sent for the project
- metadata. quadraticFundingConfig. matchingFundsAvailable: the amount of matching funds available for the project
- metadata. quadraticFundingConfig. matchingCap: the maximum amount of matching funds available for the project
- metadata. quadraticFundingConfig. minDonationThreshold: the minimum donation required to be eligible for matching funds
- metadata. quadraticFundingConfig. sybilDefense: the sybil defense mechanism used for the project
- metadata. quadraticFundingConfig. matchingCapAmount: the maximum amount of matching funds available for the project
- metadata. quadraticFundingConfig. minDonation ThresholdAmount: the minimum donation required to be eligible for matching funds, in the token used for funding.
data2.describe()
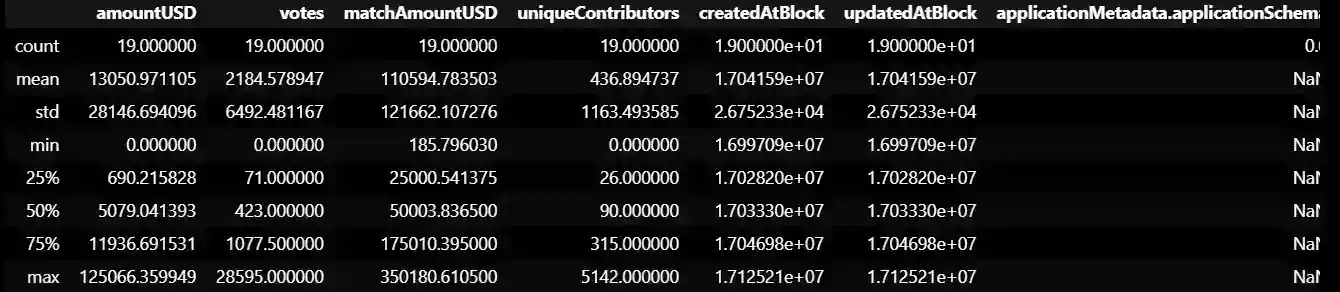
This is the summary statistics for some of the columns in the pandas DataFrame.
- count: the number of non-null values in the column
- mean: the mean (average) of the values in the column
- std: the standard deviation of the values in the column
- min: the minimum value in the column
- 25%: the 25th percentile value in the column
- 50%: the median (50th percentile) value in the column
- 75%: the 75th percentile value in the column
- max: the maximum value in the column
The columns included in this summary are:
- amountUSD: the amount of funding in USD for the round
- votes: the number of votes received for the project in the round
- matchAmountUSD: the amount of matching funds available in USD for the round
- uniqueContributors: the number of unique contributors in the round
- createdAtBlock: the block at which the funding round was created
- updatedAtBlock: the block at which the funding round was last updated
- metadata.matchingFunds. matchingFundsAvailable: the amount of matching funds available for the project
- metadata.matchingFunds. matchingCapAmount: the maximum amount of matching funds available for the project
- metadata.feesPercentage: the percentage of fees charged by the platform for the project
- metadata. quadraticFundingConfig. matchingFundsAvailable: the amount of matching funds available for the project
- metadata. quadraticFundingConfig. matchingCapAmount: the maximum amount of matching funds available for the project
- metadata. quadraticFundingConfig. minDonation ThresholdAmount: the minimum donation required to be eligible for matching funds, in the token used for funding.
For example, we can see that the mean amount of funding for a round is USD 13,050.97, with a standard deviation of USD 28,146.69. The median number of votes received for a project in a round is 423. The minimum and maximum amounts of matching funds available for a project are USD 185.80 and USD 350,180.61 respectively. The mean amount of quadratic funding cap enforced by the platform is 12.52% of the matching amount.
data2["amountUSD"]

0          0.000000
1          0.000000
2     125066.359949
3      26086.484341
4          0.000000
5      16710.300733
6      20028.925886
7       8809.485427
8      11509.156989
9        986.529090
10      3700.767996
11     12364.226073
12      5079.041393
13      6221.321860
14         0.000000
15      3961.981409
16      1160.952832
17      5889.014454
18       393.902565
Name: amountUSD, dtype: float64
plt.hist(data2["amountUSD"], bins=5)
plt.xlabel("amountUSD")
plt.ylabel("Frequency")
plt.show()
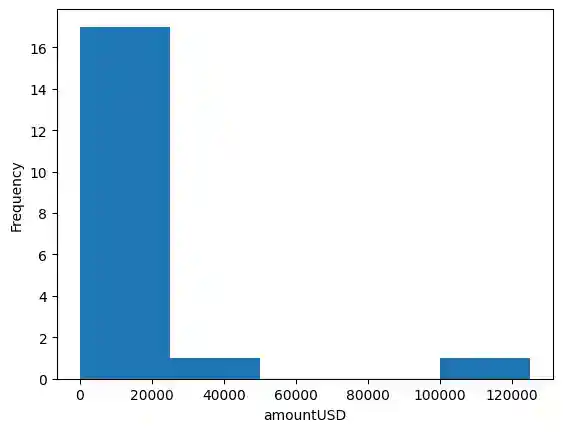
This is a histogram of the "amountUSD" column from the pandas Beta Round Data Set DataFrame.
A histogram is a graphical representation of the distribution of the data. The x-axis represents the range of values for the "amountUSD" column, and the y-axis represents the frequency of occurrence for each value range. The bins parameter specifies the number of intervals or "bins" the data is divided into.
In this case, the histogram shows the frequency of different amounts of funding in USD for the rounds. The x-axis represents the range of funding amounts, and the y-axis represents the frequency of rounds in each funding amount range. The histogram can be used to understand the distribution of the funding amounts and to identify any significant trends or outliers in the data.
The histogram is divided into 5 bins and shows the frequency of observations that fall into each bin.
From the data table, we can see that the "amountUSD" variable contains numerical values that range from 0 to over 125,000. The histogram shows that most of the observations fall into the first bin (0-25,000), with a few observations in other bins. There are very few observations in the fourth and fifth bins, which suggests that there are only a few observations with extremely high amounts of USD.
Overall, the histogram provides a visual representation of the distribution of the "amountUSD" variable and can be helpful in identifying any patterns or outliers in the data.
summary = data2.describe()
print(summary)
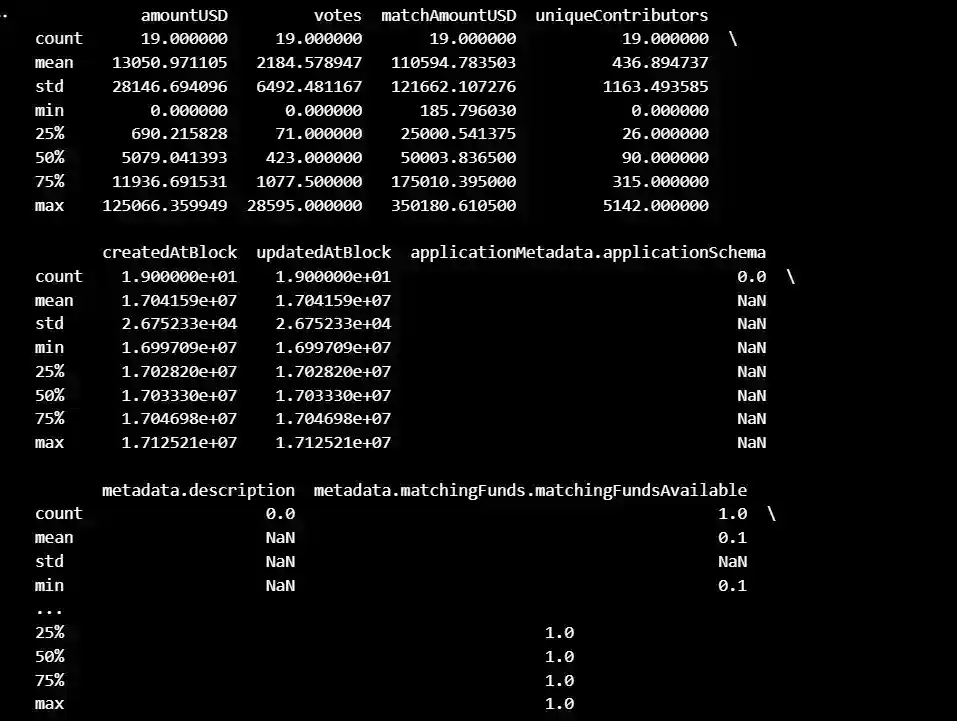
This is the summary statistics for additional columns in the pandas DataFrame "data2": "createdAtBlock", "updatedAtBlock", "applicationMetadata. applicationSchema", "metadata.description", and
"metadata.matchingFunds. matchingFundsAvailable".
For the columns "createdAtBlock" and "updatedAtBlock", the summary statistics show the minimum, maximum, mean, and standard deviation of the block number where the project was created and last updated.
For the columns "applicationMetadata. applicationSchema" and "metadata.description", the count is 0, indicating that there is no data available for these columns.
These additional summary statistics provide more details about the data in the DataFrame, such as when the projects were created and updated, and the availability of matching funds for the projects. However, some of the columns have missing data or only have data available for some of the rows. It is important to keep these limitations in mind when interpreting the summary statistics.
corr = data2[['amountUSD', 'votes', 'matchAmount', 'matchAmountUSD', 'uniqueContributors', 'metadata.quadraticFundingConfig.matchingFundsAvailable', 'metadata.quadraticFundingConfig.minDonationThreshold', 'metadata.quadraticFundingConfig.matchingCapAmount']].corr()
plt.figure(figsize=(10, 10))
sns.heatmap(corr, cmap='coolwarm', annot=True)
plt.title('Correlation Matrix')
plt.show()
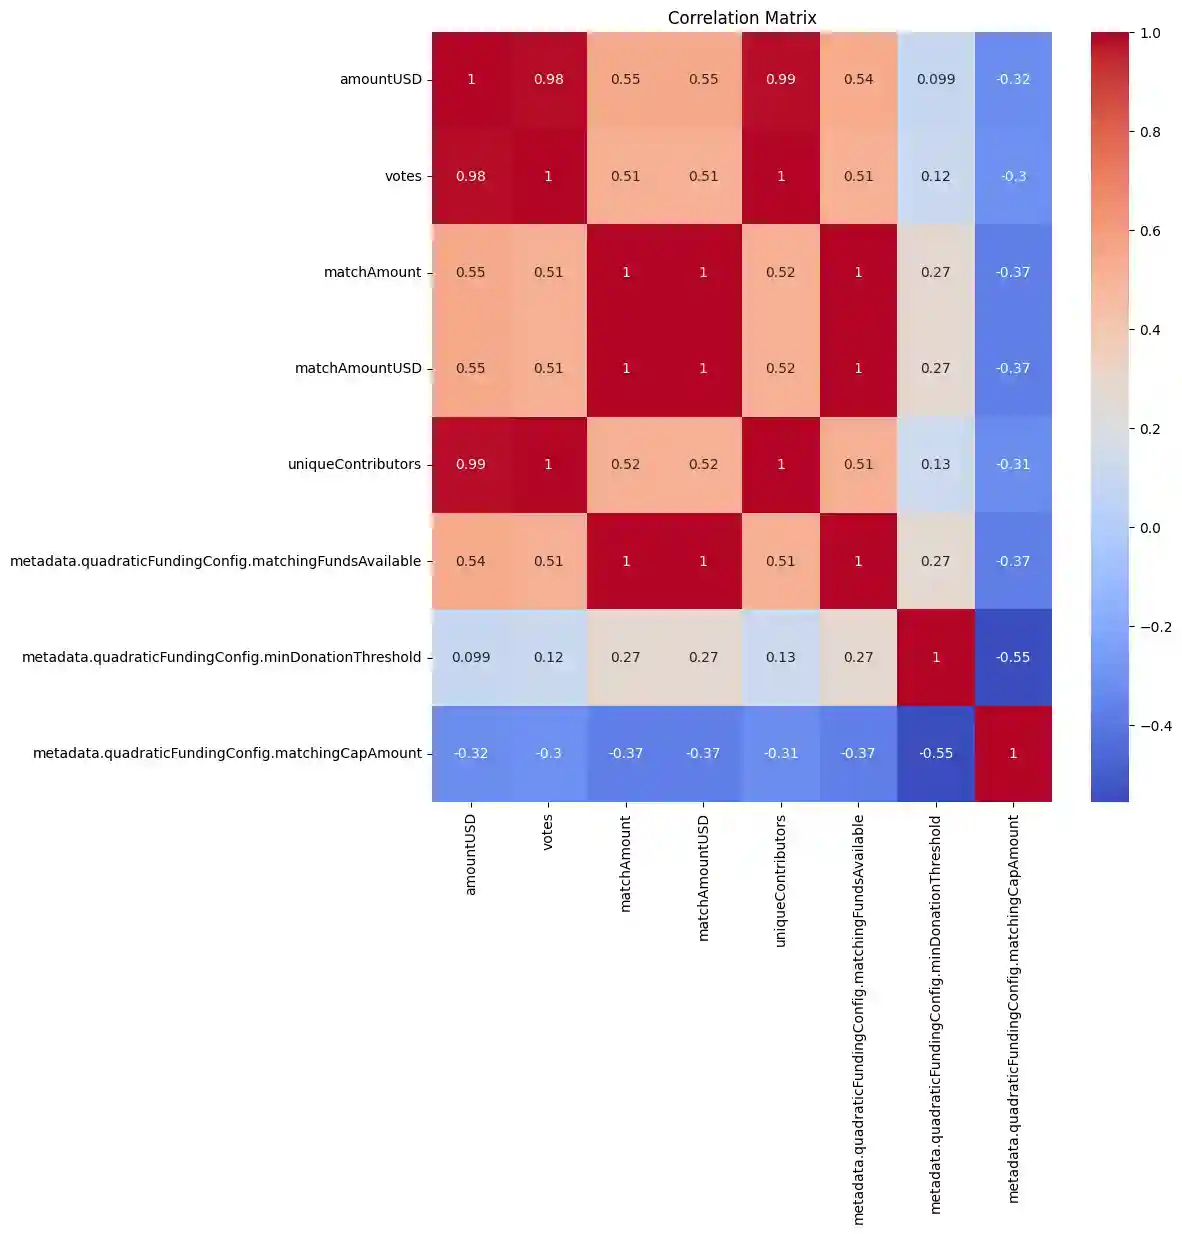
This is a correlation matrix showing the correlation coefficients between pairs of columns in the pandas Beta Round Data Set DataFrame.
A correlation coefficient is a measure of the strength and direction of the linear relationship between two variables. The correlation coefficient ranges from -1 to 1, with -1 indicating a perfect negative correlation (as one variable increases, the other decreases), 0 indicating no correlation, and 1 indicating a perfect positive correlation (as one variable increases, the other increases).
In this correlation matrix, each row and column represents a different column in the DataFrame. The correlation coefficient between each pair of columns is shown in the corresponding cell. For example, the correlation coefficient between "amountUSD" and "votes" is 0.982121, indicating a strong positive correlation between the amount of funding and the number of votes received. Similarly, there is a strong positive correlation between "uniqueContributors" and "votes" with a correlation coefficient of 0.998975, indicating that projects with more unique contributors tend to receive more votes.
The correlation matrix can be used to identify which columns are strongly correlated (either positively or negatively) with each other. This information can be used to understand the relationships between different variables and to identify potential multicollinearity issues in a regression analysis.
Beta Round Votes. Transactions by wallet and more
datavotes
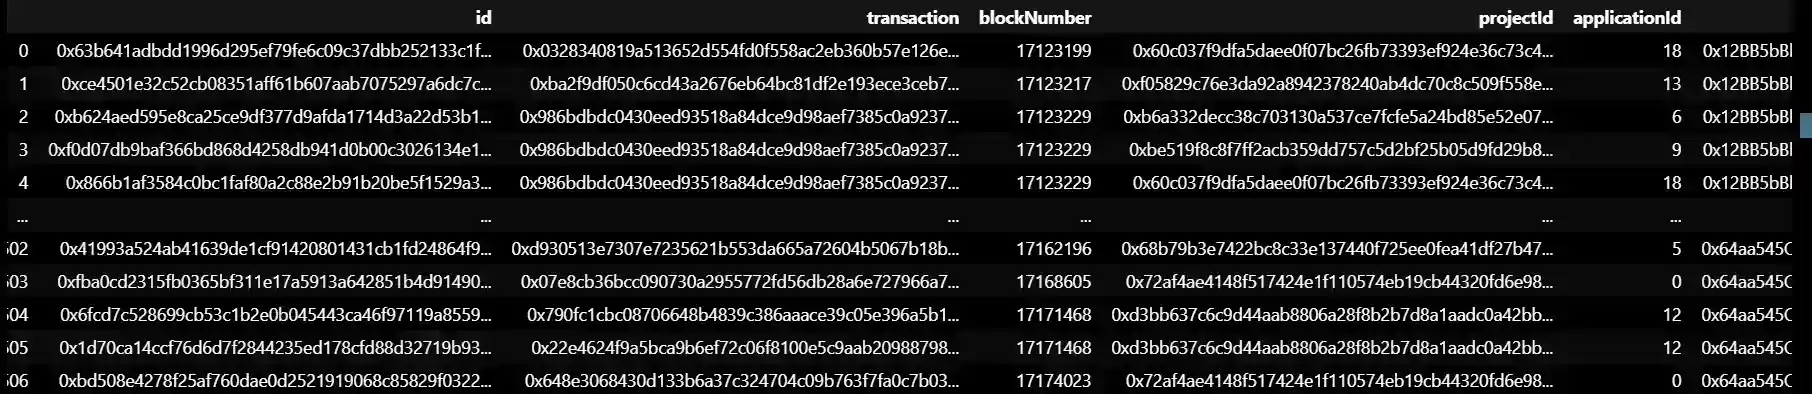
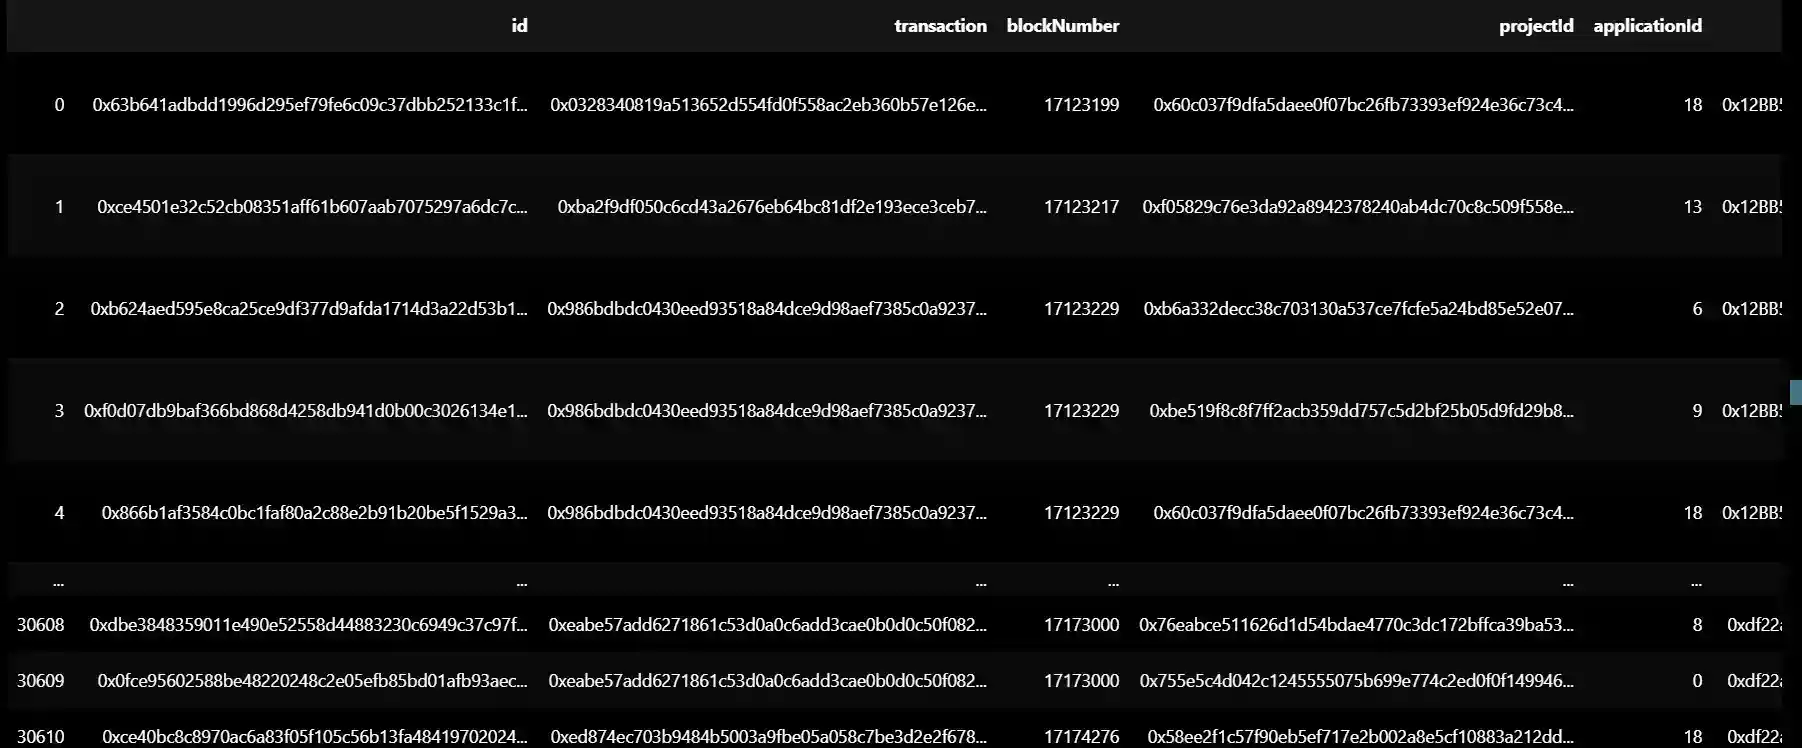
This data represent transactions made on a blockchain platform, related to grant funding for projects. Each row in the dataset represents a single transaction, with various pieces of information related to that transaction, such as the transaction ID, block number, and project ID.
The "amount" column represents the amount of cryptocurrency (in wei) that was transferred as part of the transaction, while the "amountUSD" column represents the approximate value of that cryptocurrency in USD at the time of the transaction. The "amountRoundToken" column represents a specific type of token that was used in the transaction.
Other columns, such as "voter" and "grantAddress," provide additional context about the parties involved in the transaction. Overall, this dataset contains information about the flow of funds and grants within a particular blockchain ecosystem.
datavotes.info()
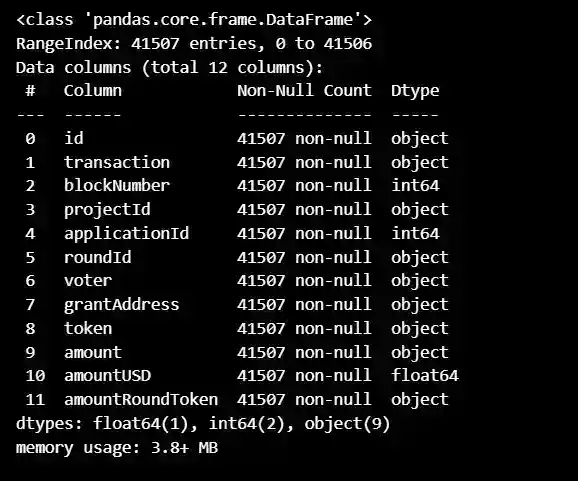
This is a Pandas DataFrame object that contains data related to transactions made on a blockchain platform. The DataFrame has 41507 rows and 12 columns. Each row represents a single transaction, and the columns provide information about that transaction, such as the transaction ID, block number, project ID, and voter.
The data type of each column is also provided, with three columns being integers, one being a float, and the remaining nine being objects (i.e., strings). The "amount" and "amountRoundToken" columns are also stored as objects, which suggests that they may need to be converted to numeric values before they can be used for calculations or other analyses.
Overall, this DataFrame provides a structured way to work with the transaction data and perform various analyses or manipulations on it using Python and the Pandas library.
datavotes.describe()
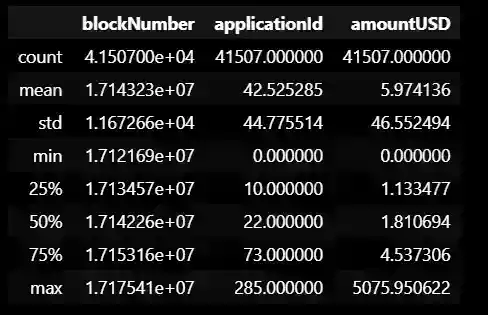
This is a summary of some of the key statistics for the "blockNumber", "applicationId", and "amountUSD" columns of the DataFrame:
"blockNumber": This column represents the number of the block in which the transaction was recorded on the blockchain platform. The "count" row indicates that there are 41507 non-null values in this column, which means there are no missing values. The "mean" row indicates that the average block number is 1.714323e+07 (approximately 17 million). The "std" row indicates that the standard deviation of block numbers is 11672.66. The "min" and "max" rows indicate the smallest and largest block numbers in the dataset.
"applicationId": This column represents the ID number of the grant application associated with the transaction. The "count" row indicates that there are 41507 non-null values in this column, which means there are no missing values. The "mean" row indicates that the average application ID is 42.525285. The "std" row indicates that the standard deviation of application IDs is 44.775514. The "min" and "max" rows indicate the smallest and largest application IDs in the dataset.
"amountUSD": This column represents the approximate value of the cryptocurrency (in USD) that was transferred as part of the transaction. The "count" row indicates that there are 41507 non-null values in this column, which means there are no missing values. The "mean" row indicates that the average amount transferred was $5.974136. The "min" and "max" rows indicate the smallest and largest amounts transferred in the dataset.
datavotes = datavotes.merge(data, left_on='roundId', right_on='Round ID')
datavotes.sort_values(['roundId', 'blockNumber'], ascending=[True, True])
datavotes['cummul'] = datavotes.groupby('roundId')['amountUSD'].cumsum()
datavotes
px.scatter(datavotes, x = datavotes.blockNumber, y = datavotes.amountUSD, color="Round name", marginal_x="histogram", marginal_y="rug")
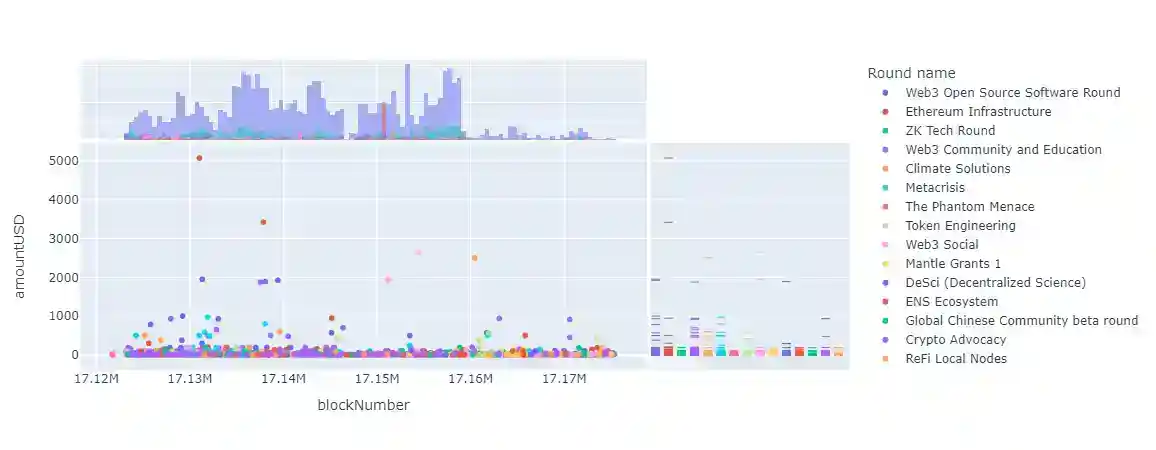
The scatter plot shows the relationship between blockNumber and amountUSD, with the points colored by Round name. The blockNumber is the block number of Ethereum blockchain where a vote was cast, while amountUSD is the amount of USD equivalent of the vote. The scatter plot shows how the amount of USD equivalent of the votes changes over time i.e., block number, and whether there are any patterns or trends in the data.
The color of the points indicate which round or source the votes came from. The histogram and rug plot give some insight into the distribution of the data for each variable.
px.scatter(datavotes, x = datavotes.blockNumber, y = datavotes.cummul, color="Round name", marginal_x="histogram", marginal_y="rug")
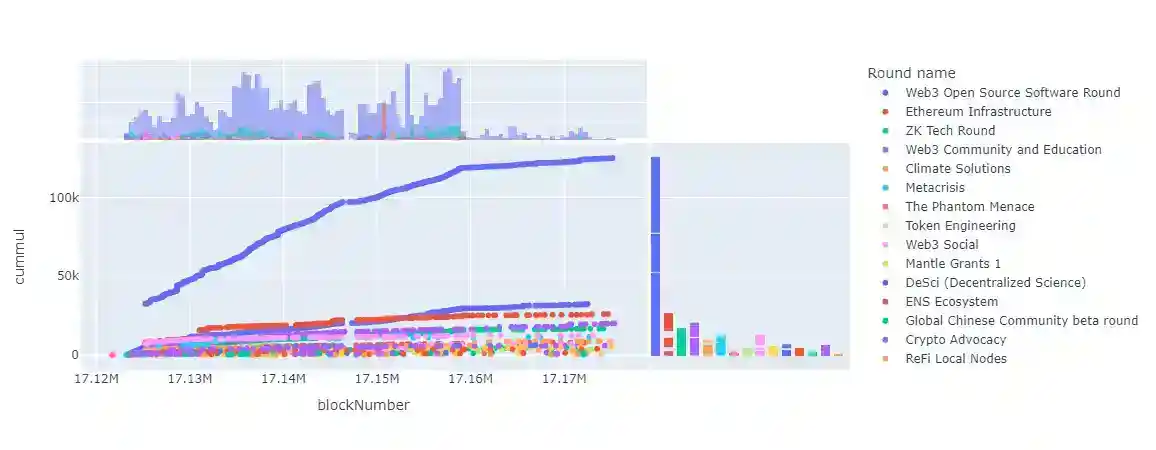
The scatter plot shows the relationship between blockNumber and cummul, with the points colored by Round name. cummul is a cumulative sum of some quantity, and Round name refers to a round of voting or funding. The scatter plot shows how the cumulative sum changes over time i.e., block number for each round, and whether there are any patterns or trends in the data.
We have loaded data here datavotes.to_csv('dataframe.csv') You can buy them by clicking on the link.
Beta Round Overall Round Data. More metadata like cap level and summary info
dataoverall
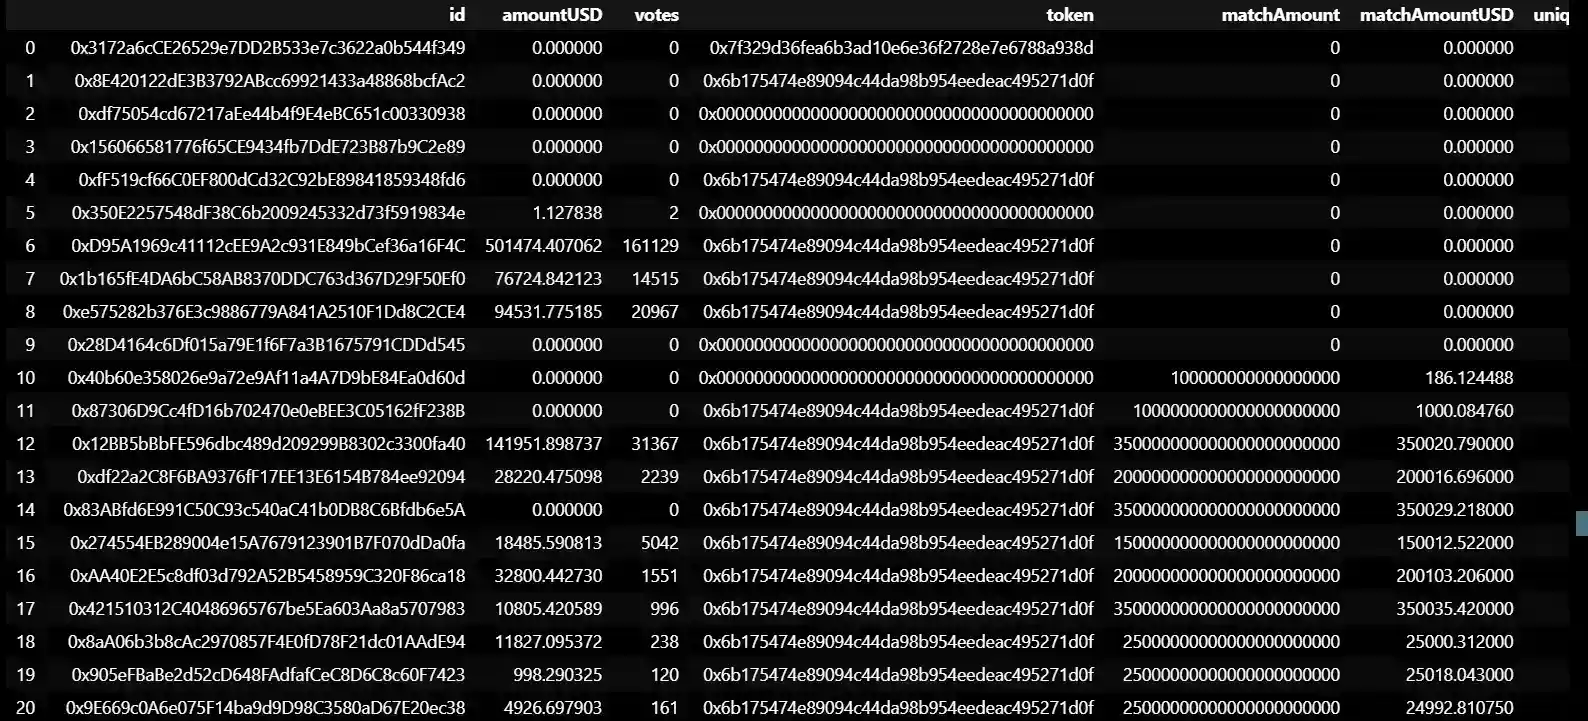
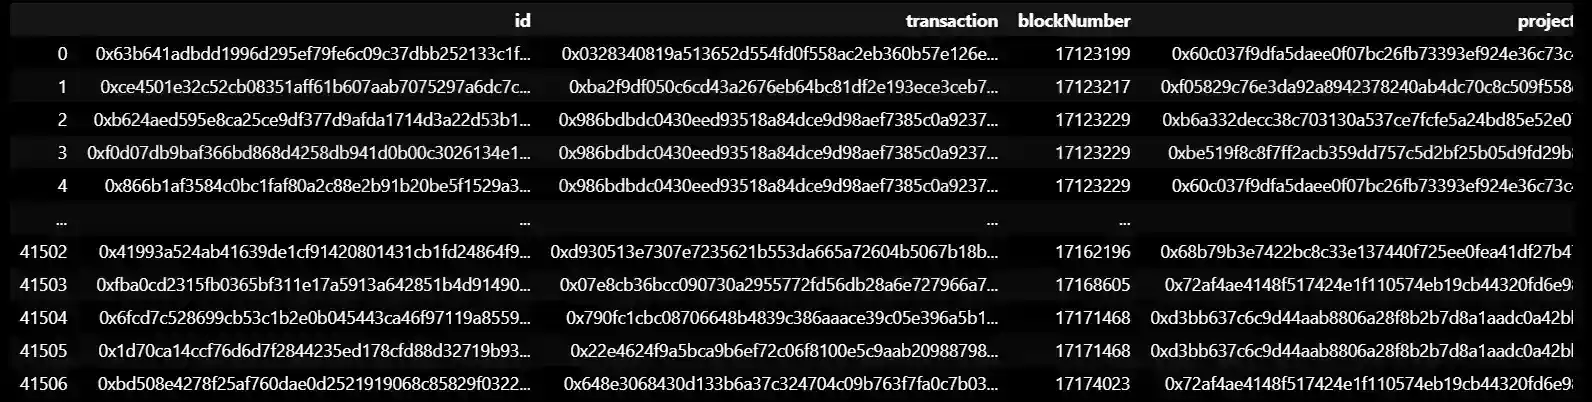
This is a sample of rows from the original DataFrame, with various columns and their associated values listed for each row. Each row represents a single transaction on a blockchain platform.
The columns and their meanings are:
- "id": The ID number of the transaction.
- "transaction": The details of the transaction.
- "blockNumber": The number of the block in which the transaction was recorded on the blockchain platform.
- "projectId": The ID number of the project associated with the transaction.
- "applicationId": The ID number of the grant application associated with the transaction.
- "roundId": The ID number of the funding round associated with the transaction.
- "voter": The address of the voter who participated in the transaction.
- "grantAddress": The address of the grantee who received the funds as part of the transaction.
- "token": The type of cryptocurrency token used in the transaction.
- "amount": The amount of cryptocurrency (in wei) transferred as part of the transaction.
- "amountUSD": The approximate value of the cryptocurrency transferred in USD at the time of the transaction.
- "amountRoundToken": The amount of a specific token used in the transaction.
The "NaN" values in some of the columns suggest that there may be missing data in those rows. Overall, this is a sample of the raw transaction data in the DataFrame, with each row providing specific details about a single transaction.
dataoverall.info()
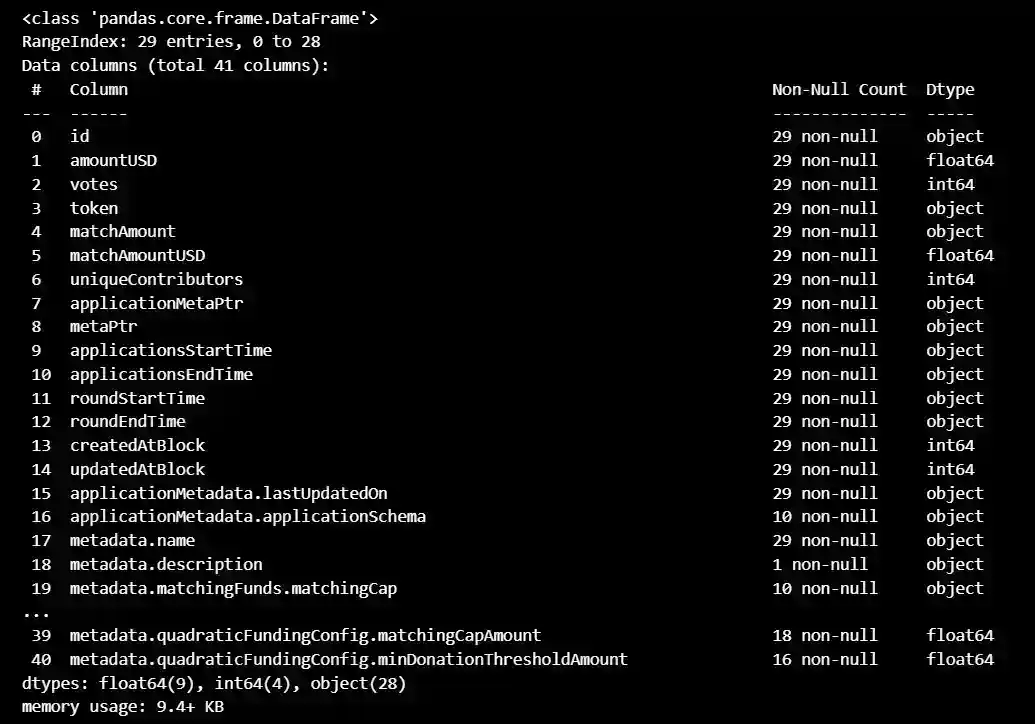
This is a dataset with 29 entries and 41 columns, containing information about crowdfunding campaigns. The columns include details such as the ID of the campaign, the amount of money raised in, the number of votes received, the type of token used, the start and end times for the campaign, and various metadata such as the name and description of the campaign, eligibility requirements, and configurations. There are also several columns with missing data.
dataoverall.describe()
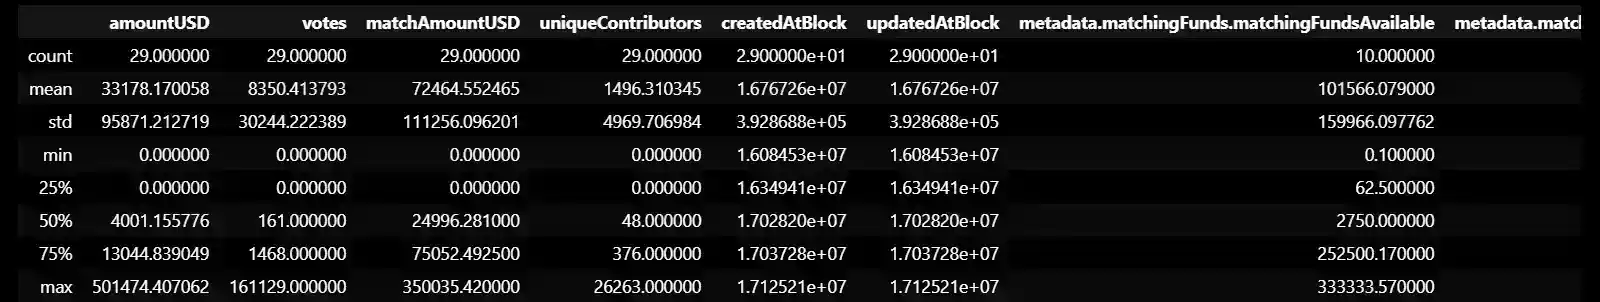
This data shows various statistics for 29 crowdfunding campaigns. Here is an explanation of each column:
- amountUSD: the amount of money raised in US dollars
- votes: the number of votes received
- matchAmountUSD: the amount of money matched in US dollars
- uniqueContributors: the number of unique contributors to the campaign
- createdAtBlock: the block number at which the campaign was created
- updatedAtBlock: the block number at which the campaign was last updated
- metadata.matchingFunds. matchingFundsAvailable: whether matching funds were available for the campaign
- metadata.matchingFunds. matchingCapAmount: the maximum amount of matching funds available
- metadata.feesPercentage: the percentage of fees charged by the platform for the campaign
- metadata.feesAddress: the address to which fees were sent
- metadata. quadraticFundingConfig. matchingFundsAvailable: whether quadratic funding was enabled for the campaign
- metadata. quadraticFundingConfig. matchingCapAmount: the maximum amount of matching funds available for quadratic funding
- metadata. quadraticFundingConfig. minDonation ThresholdAmount: the minimum donation amount required to qualify for quadratic funding
The "count" row shows the number of non-missing values for each column, the "mean" row shows the average value for each column, and the "std" row shows the standard deviation for each column. The "min" row shows the minimum value for each column, and the "max" row shows the maximum value for each column.
df = pd.read_csv('../Untitled Folder/overall.csv')
df.describe()
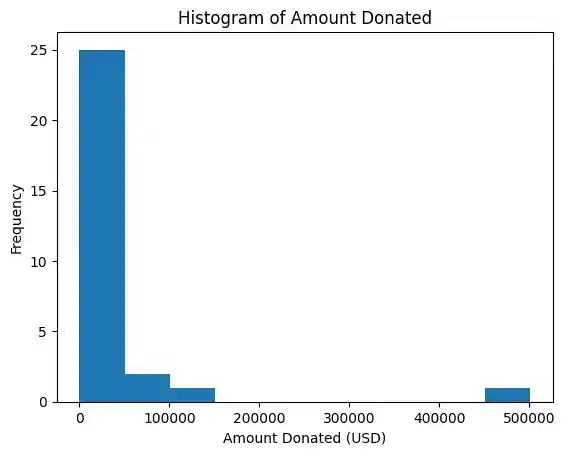
plt.hist(df['amountUSD'])
plt.xlabel('Amount Donated (USD)')
plt.ylabel('Frequency')
plt.title('Histogram of Amount Donated')
plt.show()
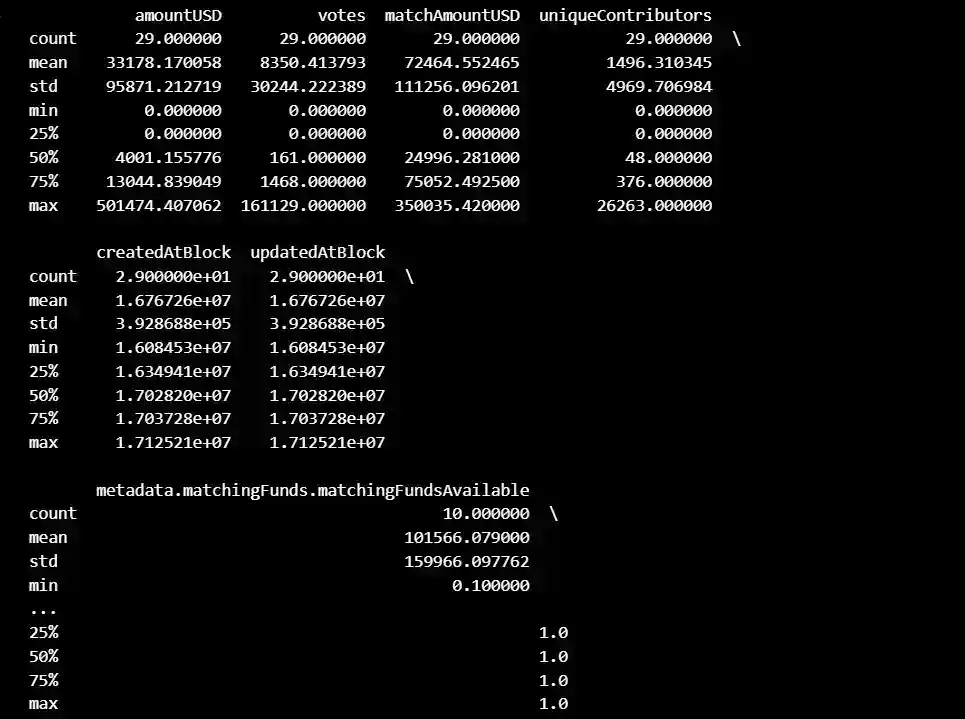
This is the summary statistics table that was previously shown.
Each column represents a variable or feature of the crowdfunding campaigns. The "count" row shows the number of non-missing values for each column, the "mean" row shows the average value for each column, and the "std" row shows the standard deviation for each column. The "min" row shows the minimum value for each column, and the "max" row shows the maximum value for each column.
Here's a brief explanation of the columns:
- amountUSD: the amount of money raised in US dollars
- votes: the number of votes received
- matchAmountUSD: the amount of money matched in US dollars
- uniqueContributors: the number unique contributors to the campaign
- createdAtBlock: the block number at which the campaign was created
- updatedAtBlock: the block number at which the campaign was last updated
- metadata.matchingFunds. matchingFundsAvailable: whether matching funds were available for the campaign
- metadata.matchingFunds. matchingCapAmount: the maximum amount of matching funds available
- metadata.feesPercentage: the percentage of fees charged by the platform for the campaign
- metadata.feesAddress: the address to which fees were sent
- metadata. quadraticFundingConfig. matchingFundsAvailable: whether quadratic funding was enabled for the campaign
- metadata. quadraticFundingConfig. matchingCapAmount: the maximum amount of matching funds available for quadratic funding
- metadata. quadraticFundingConfig. minDonation ThresholdAmount: the minimum donation amount required to qualify for quadratic funding
For some columns, such as "metadata.feesAddress", there are no non-missing values, which means that this feature was not recorded for any of the campaigns.
This histogram shows the distribution of the amount of money donated in US dollars across all campaigns. The x-axis shows the range of donation amounts, and the y-axis shows the frequency of donation amounts falling within each range. The title and axis labels provide additional information about the plot.
with_matching = df[df['matchAmountUSD'] > 0]['amountUSD']
without_matching = df[df['matchAmountUSD'] == 0]['amountUSD']
t, p = stats.ttest_ind(with_matching, without_matching)
print(f'T-test results: t = {t}, p = {p}')
contingency_table = pd.crosstab(df['uniqueContributors']>0, df['votes']>0)
chi2, p, dof, expected = stats.chi2_contingency(contingency_table)
print(f'Chi-square test results: chi2 = {chi2}, p = {p}, dof = {dof}')

T-test results: t = -1.4139695721276109, p = 0.16879855974049224
Chi-square test results: chi2 = 24.742583102493075, p = 6.552044616417999e-07, dof = 1
The t-test results indicate whether there is a significant difference between the average amounts of contributions with and without matches. The t-value is a measure of how many standard errors the means are apart, while the p-value is the probability of obtaining a t-value as extreme or more extreme than the one observed, assuming that there is no difference between the means. In this case, a low p-value suggests that there is a significant difference between the means.
The chi-square test results indicate whether there is a significant association between the presence of unique contributors and the presence of votes. The chi-square statistic measures how much the observed counts differ from the expected counts, assuming that there is no association between the variables. The p-value is the probability of obtaining a chi-square statistic as extreme or more extreme than the one observed, assuming that there is no association between the variables. In this case, a low p-value suggests that there is a significant association between the variables. The degrees of freedom (dof) represent the number of values in the contingency table that are free to vary.
X = df[['votes', 'uniqueContributors']]
y = df['amountUSD']
X = sm.add_constant(X)
model = sm.OLS(y, X).fit()
print(model.summary())
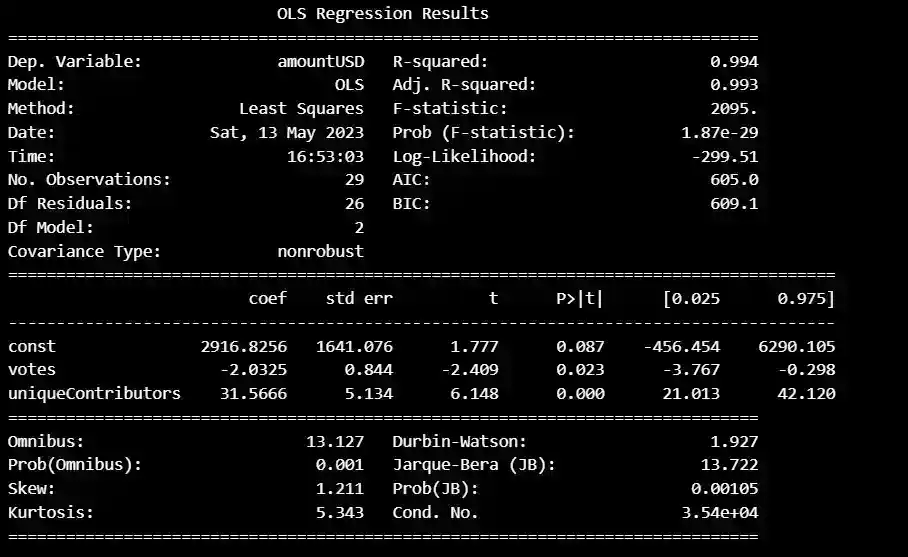
This is a summary table of the results of a linear regression model that was fitted to the data. The model predicts the amount of money raised in US dollars (the dependent variable) using two independent variables: the number of votes received and the number of unique contributors to the campaign.
The "coef" column shows the estimated coefficients for each variable, which represent the change in the dependent variable associated with a one-unit increase in the corresponding independent variable, holding all other variables constant. For example, the coefficient for "votes" (-2.0325) suggests that, on average, a one-unit increase in the number of votes received is associated with a decrease of about $2 in the amount of money raised, holding the number of unique contributors constant.
The "std err" column shows the standard errors of the estimated coefficients, which are used to compute the t-statistic and p-value for testing the null hypothesis that each coefficient is equal to zero.
The "t" column shows the t-statistic for each coefficient, which measures the number of standard errors by which the estimated coefficient differs from zero.
The "P>|t|" column shows the p-value for each coefficient, which represents the probability of obtaining a t-statistic as extreme or more extreme than the observed value, assuming the null hypothesis is true. A p-value less than 0.05 is typically considered statistically significant, which means that the corresponding is likely to have a non-zero effect on the dependent variable.
The "R-squared" value (0.994) is a measure of how well the model fits the data, with values closer to 1 indicating a better fit. In this case, the high R-squared value suggests that the model explains a large proportion of the variation in the dependent variable.
The "Omnibus", "Prob(Omnibus)", "Skew", "Kurtosis", and "Cond. No." rows provide additional diagnostic information about the model's assumptions and fit.
Conclusion
In conclusion, this post provided an analysis of the Gitcoin Beta Round Stats, exploring the rounds and the number of grants in each round. The data revealed that there were 19 rounds with an average of 52.79 projects funded per round. The histogram visualization showed that most rounds had relatively low numbers of total projects, with a few rounds having significantly higher numbers. The summary statistics provided insights into the funding amounts, votes received, matching funds, and unique contributors for each round. The correlation matrix demonstrated strong positive correlations between funding amounts, votes, and unique contributors, indicating their interdependency. Overall, this analysis sheds light on the grant funding process and provides valuable information for understanding the dynamics of the Gitcoin Beta Rounds.
Further Resources
- Granular Grant dataset on Ocean Marketplace
- Exploring and Refactoring Contraktor - Ethereum Explorer
- Exploring Ethereum Network with Etherscan and BlockScout
- Blockchain Data Indexer with TrueBlocks
- Advanced Realized Volatility and Quarticity
- Machine Learning with Sklearn
- How to illustrate log returns vs simple returns
- A How to EfficientNet Classification